Setup Container Insights for NodeJS App
Let’s now enable container insights for the NodeJS App running in the EKS cluster. Let’s deploy the Container Insights in the cluster using the following command:
# Set environment variables
CLUSTER_NAME="$(echo $C9_PROJECT | sed 's/^Project-//' | tr 'A-Z' 'a-z')"
AWS_REGION=$(curl -s 169.254.169.254/latest/dynamic/instance-identity/document | grep region | cut -d\" -f4)

# Deploy Container Insights
curl https://raw.githubusercontent.com/aws-samples/amazon-cloudwatch-container-insights/master/k8s-yaml-templates/quickstart/cwagent-fluentd-quickstart.yaml | \
sed "s/{{cluster_name}}/$CLUSTER_NAME/;s/{{region_name}}/$AWS_REGION/" | kubectl apply -f -
Now that we have the Container Insights properly deployed in the cluster, let’s change the NodeJS virtual node, so it will start sending logs to stdout:
# Set environment variable
NODEJS_LB_URL=$(kubectl get service nodejs-app-service -n appmesh-workshop-ns -o json | jq -r '.status.loadBalancer.ingress[].hostname')

# Update virtual node file
cat <<EOF > ~/environment/eks-scripts/virtual-node.yml
apiVersion: appmesh.k8s.aws/v1beta2
kind: VirtualNode
metadata:
  name: nodejs-app
  namespace: appmesh-workshop-ns
spec:
  podSelector:
    matchLabels:
      app: nodejs-app
  listeners:
    - portMapping:
        port: 3000
        protocol: http
  serviceDiscovery:
    dns:
      hostname: $NODEJS_LB_URL
  logging:
    accessLog:
      file:
        path: /dev/stdout
EOF

# Apply the configuration
kubectl apply -f  ~/environment/eks-scripts/virtual-node.yml
And finally, restart the pods, so it will start sending data to CloudWatch:
# Restart pods
kubectl -n appmesh-workshop-ns rollout restart deployment nodejs-app
At this moment you should be able to see data in the CloudWatch logs interface by accessing this url.
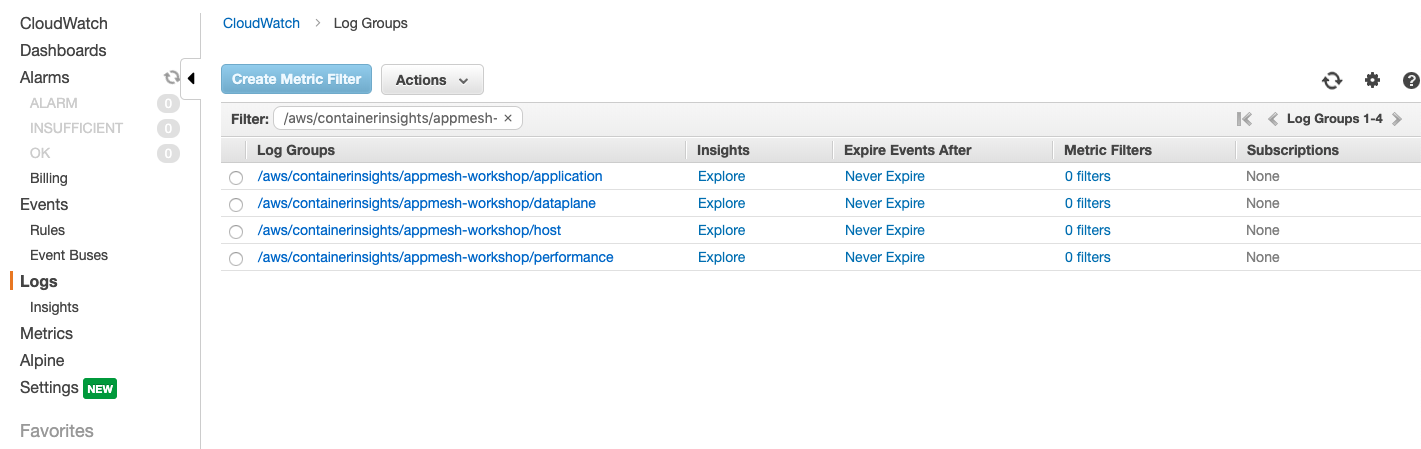
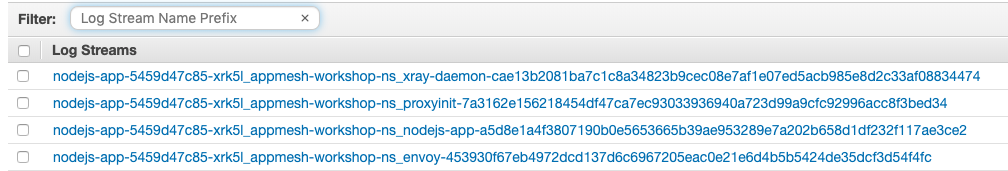
If you navigate to the /aws/containerinsights/appmesh-workshop/application will will be able to see all the logs from the nodejs-app pod, including the Envoy proxy container: